
2021-12-04

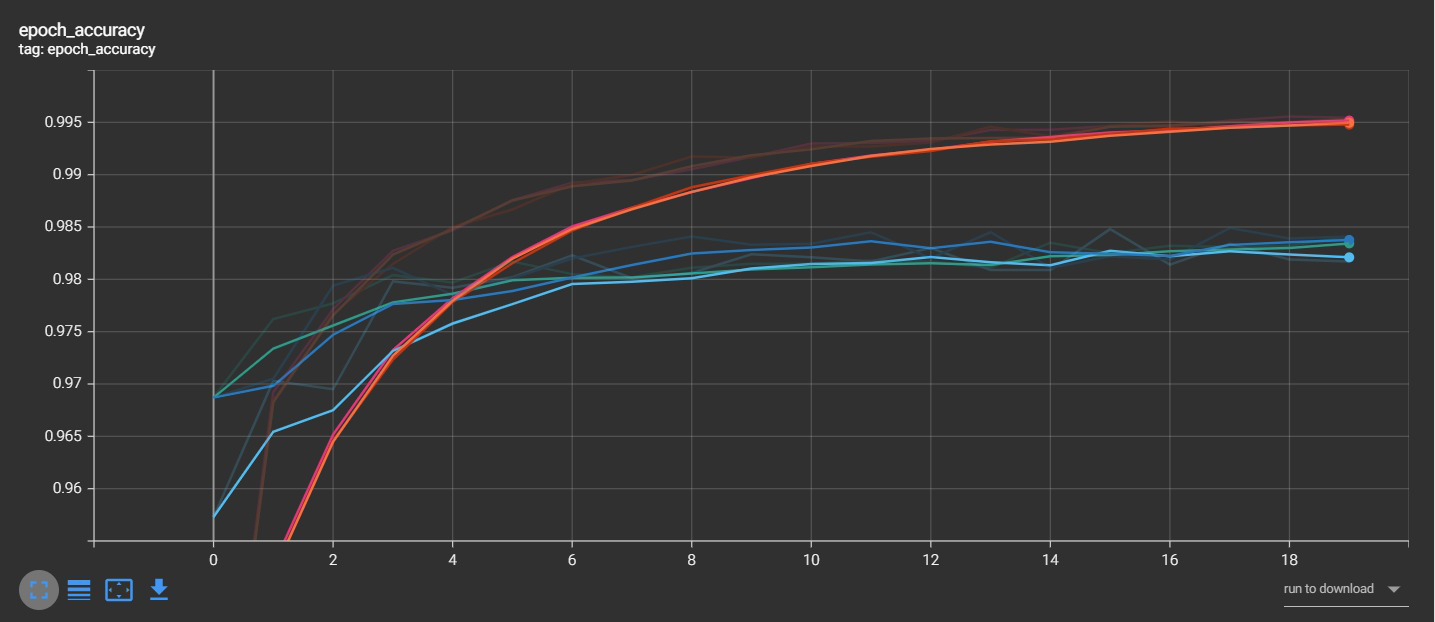
Epoch_accuracy graphs after conducting three runs of the given code:
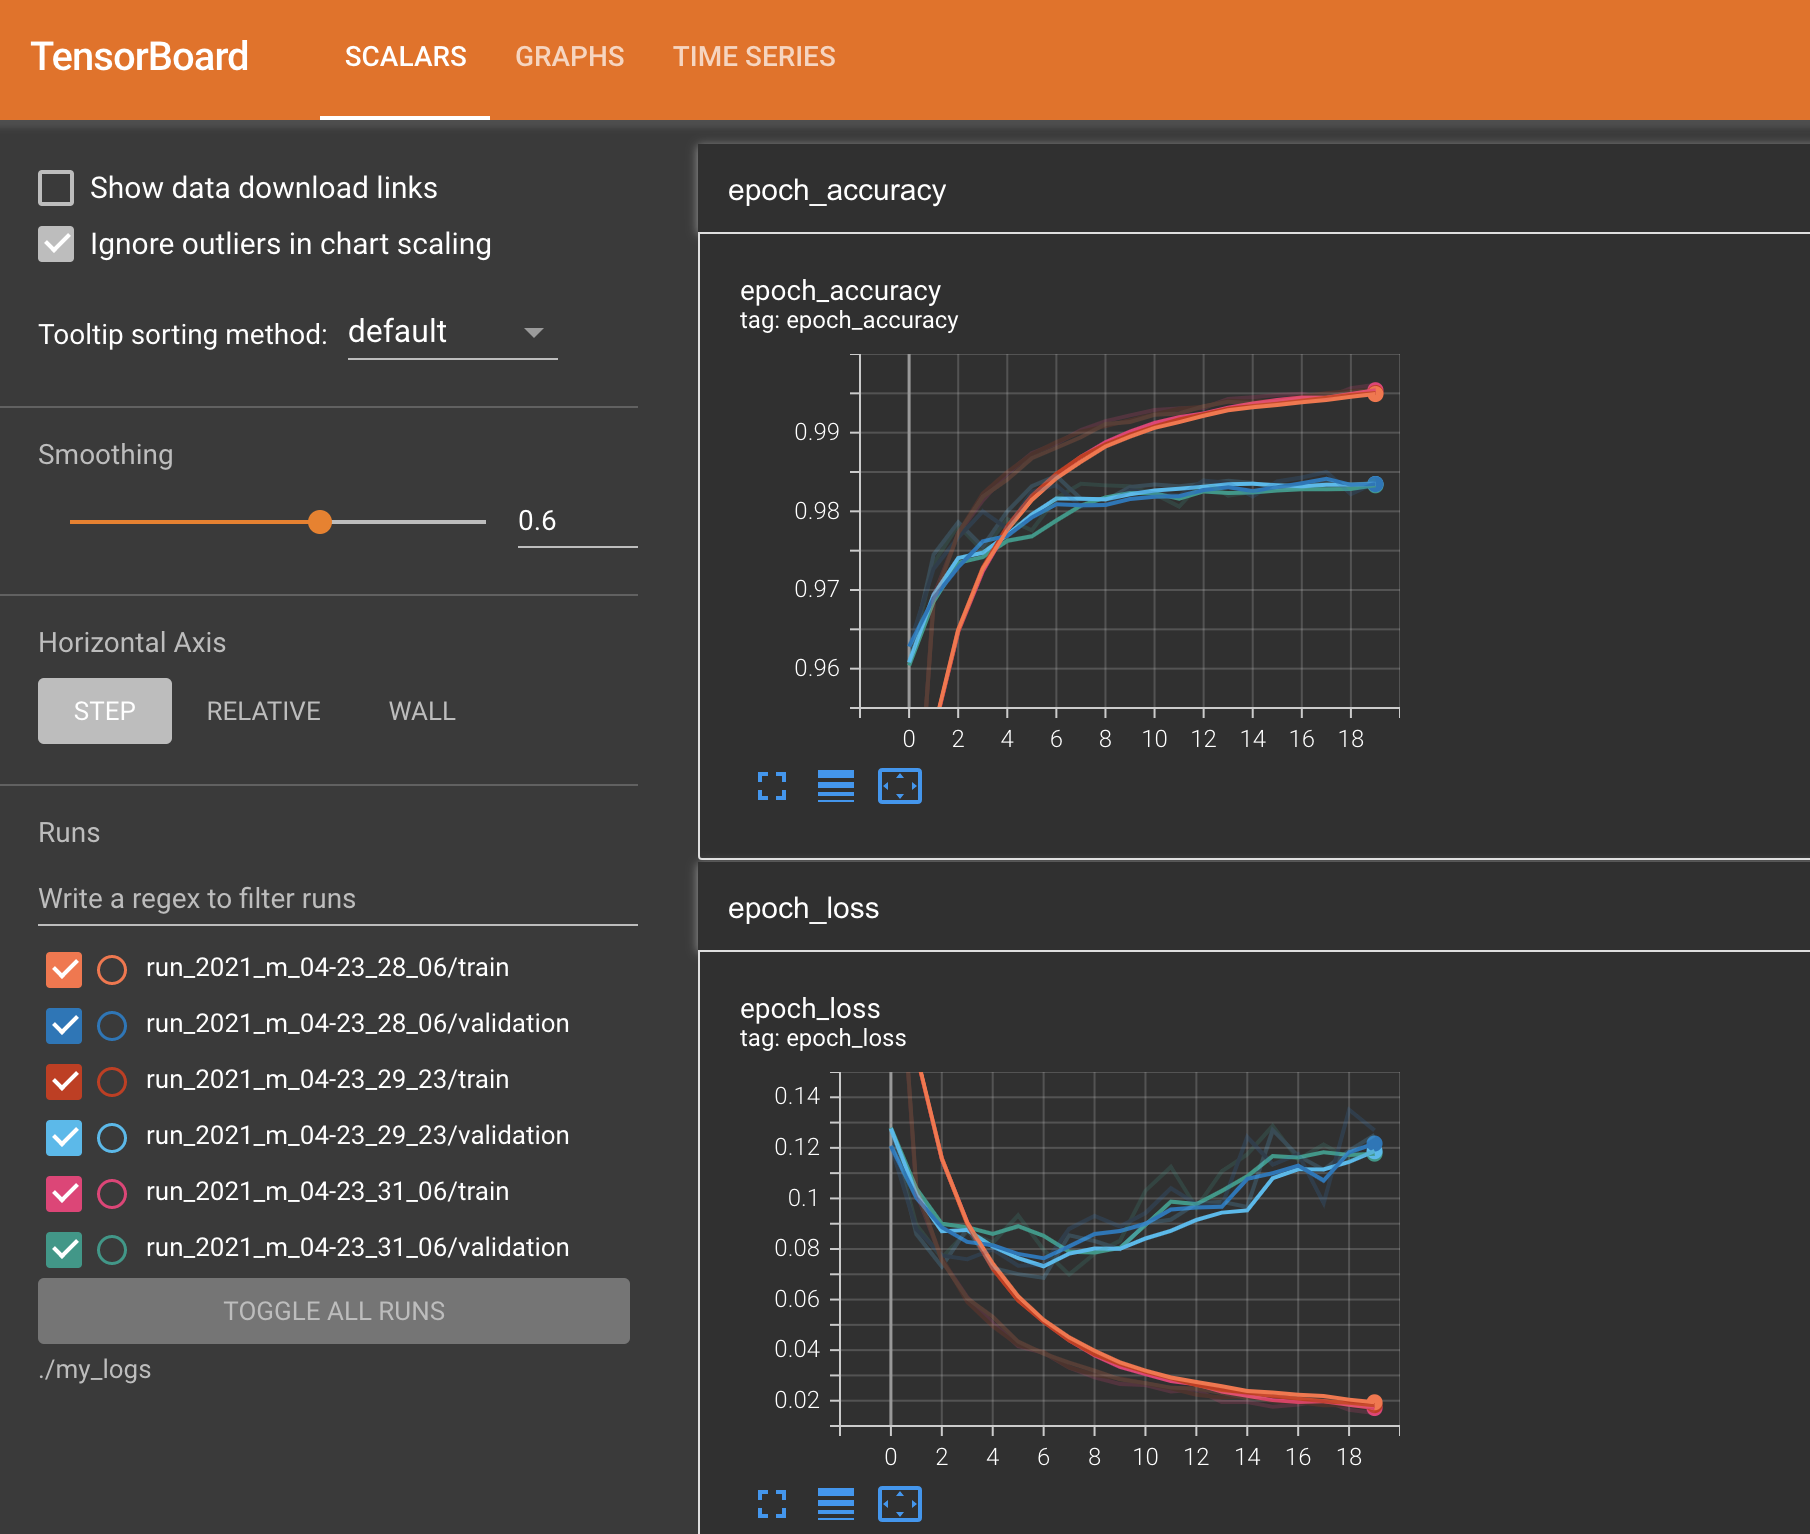
The curves are similar but there are slight differences because of data shuffling for each run.
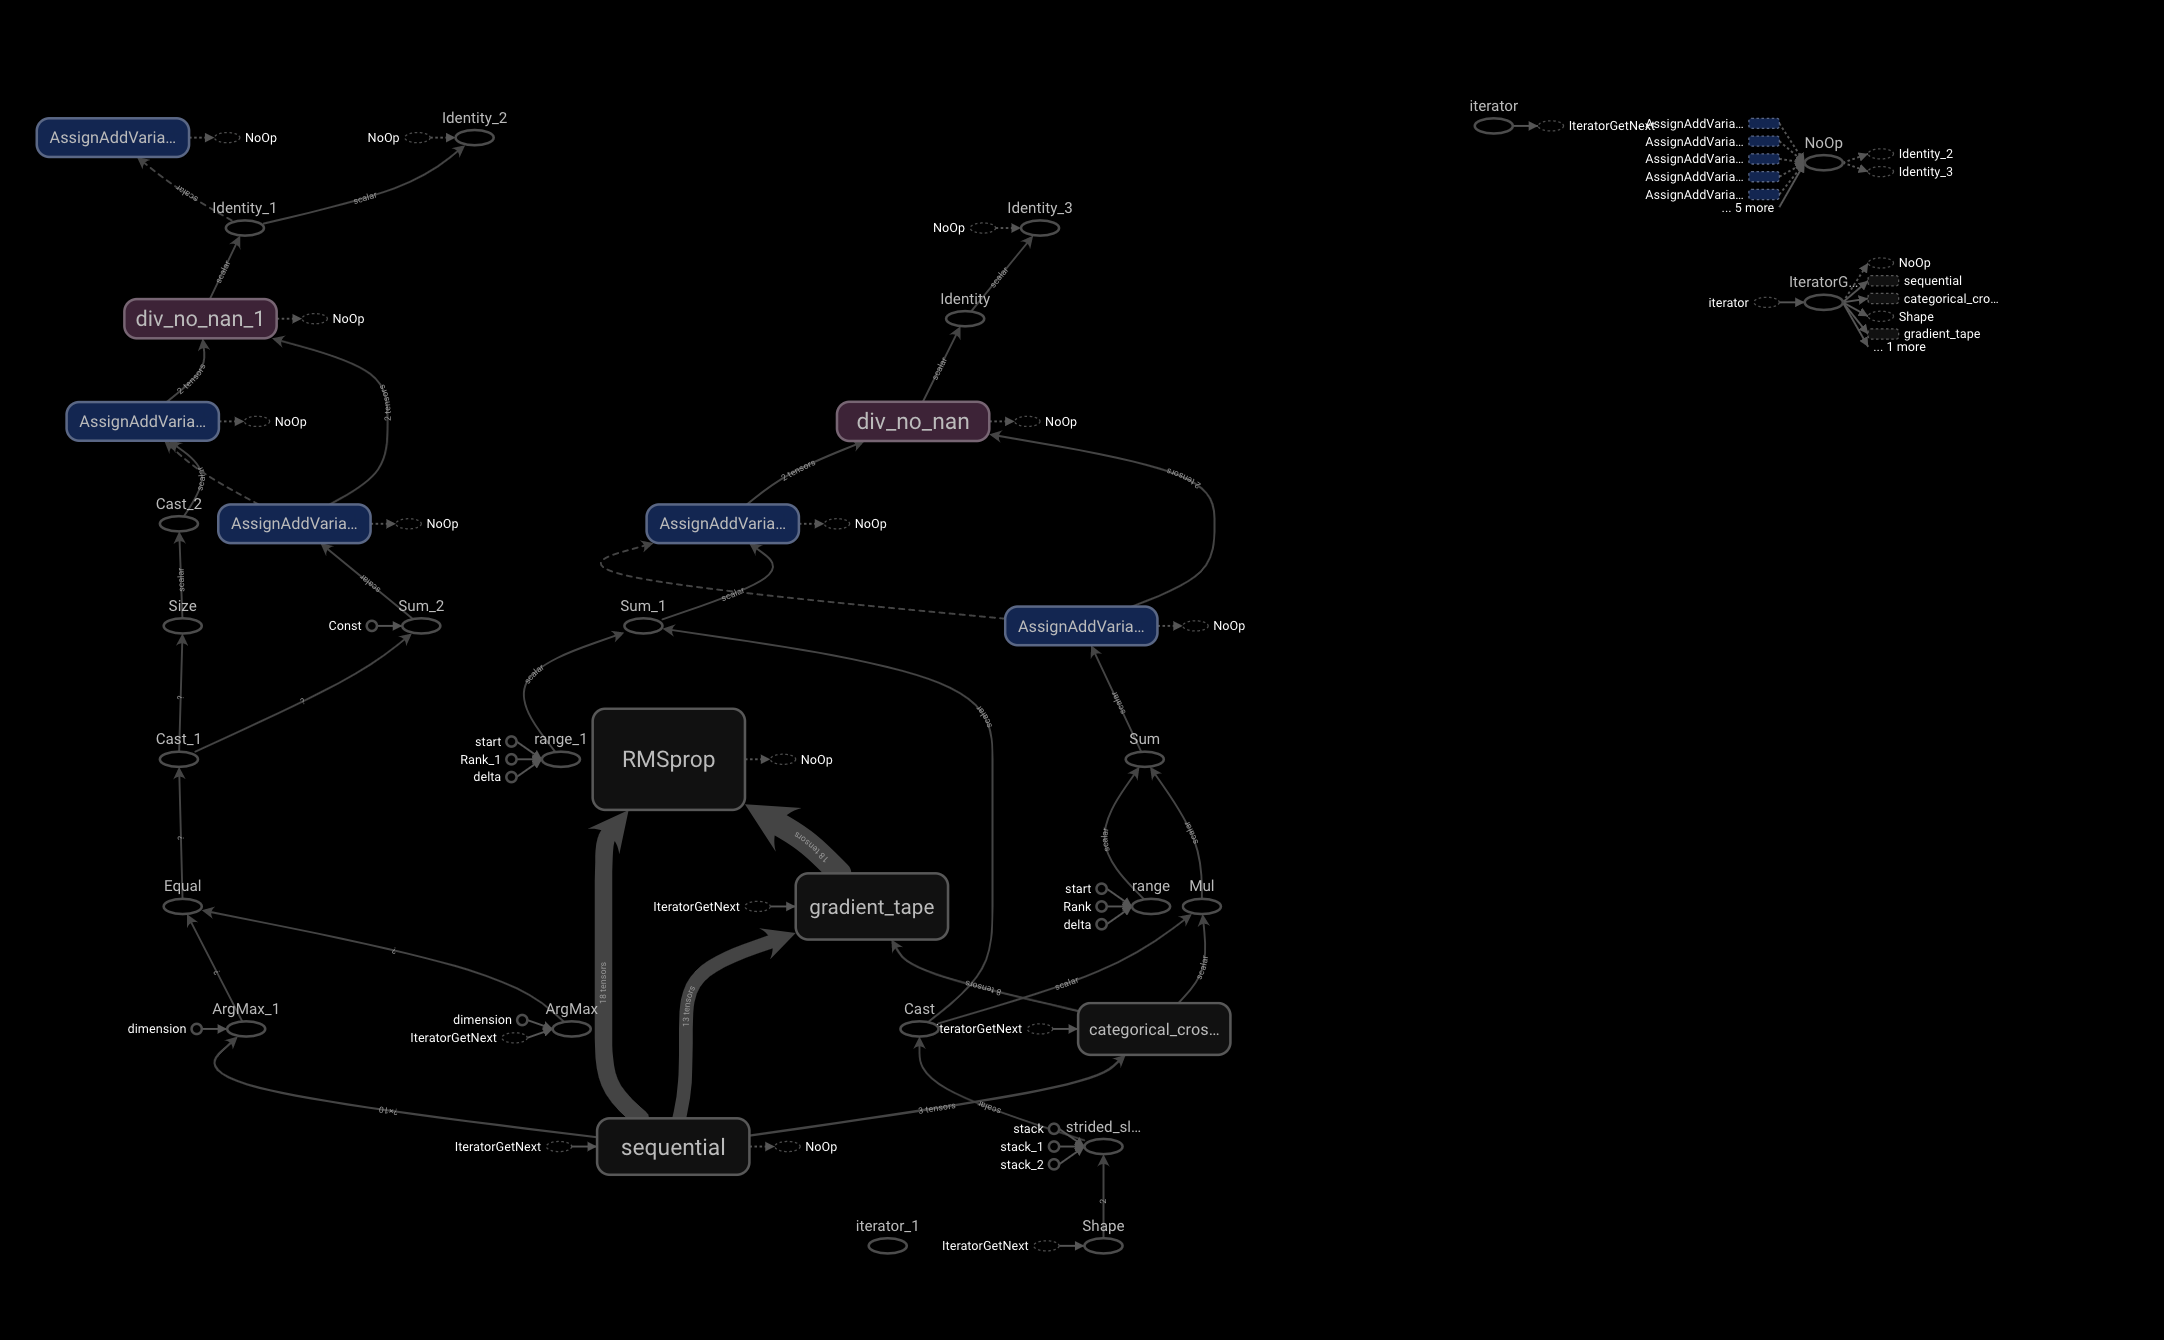
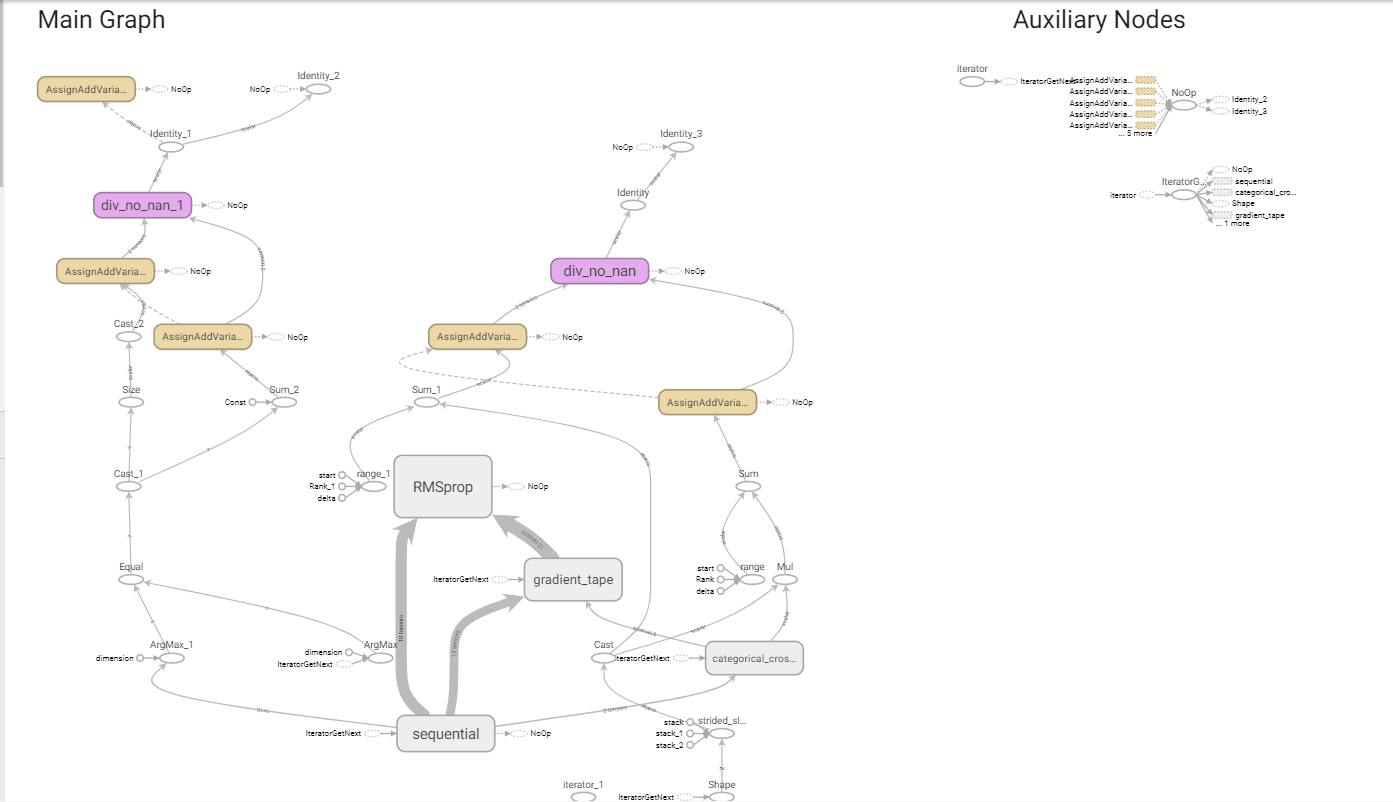
The main graph for the model is:
Epoch_accuracy graphs after conducting three runs of the given code:
<br/>
((resource:Screen Shot 2021-12-04 at 11.32.51 PM.png|Resource Description for Screen Shot 2021-12-04 at 11.32.51 PM.png))
<br/>
The curves are similar but there are slight differences because of data shuffling for each run.
<br/>
The main graph for the model is:
<br/>
((resource:Screen Shot 2021-12-04 at 11.40.45 PM.png|Resource Description for Screen Shot 2021-12-04 at 11.40.45 PM.png))
screen shot of the Tensorflow epoch_accuracy graphs:
The curves are similar that all of them have increasing accuracy after each epochs and the rate of increase decreases as the accuracy reaches ~99
The curves aren't exactly the same because the initial weights won't be the same in each run and the batches are also randomly chosen on each run.
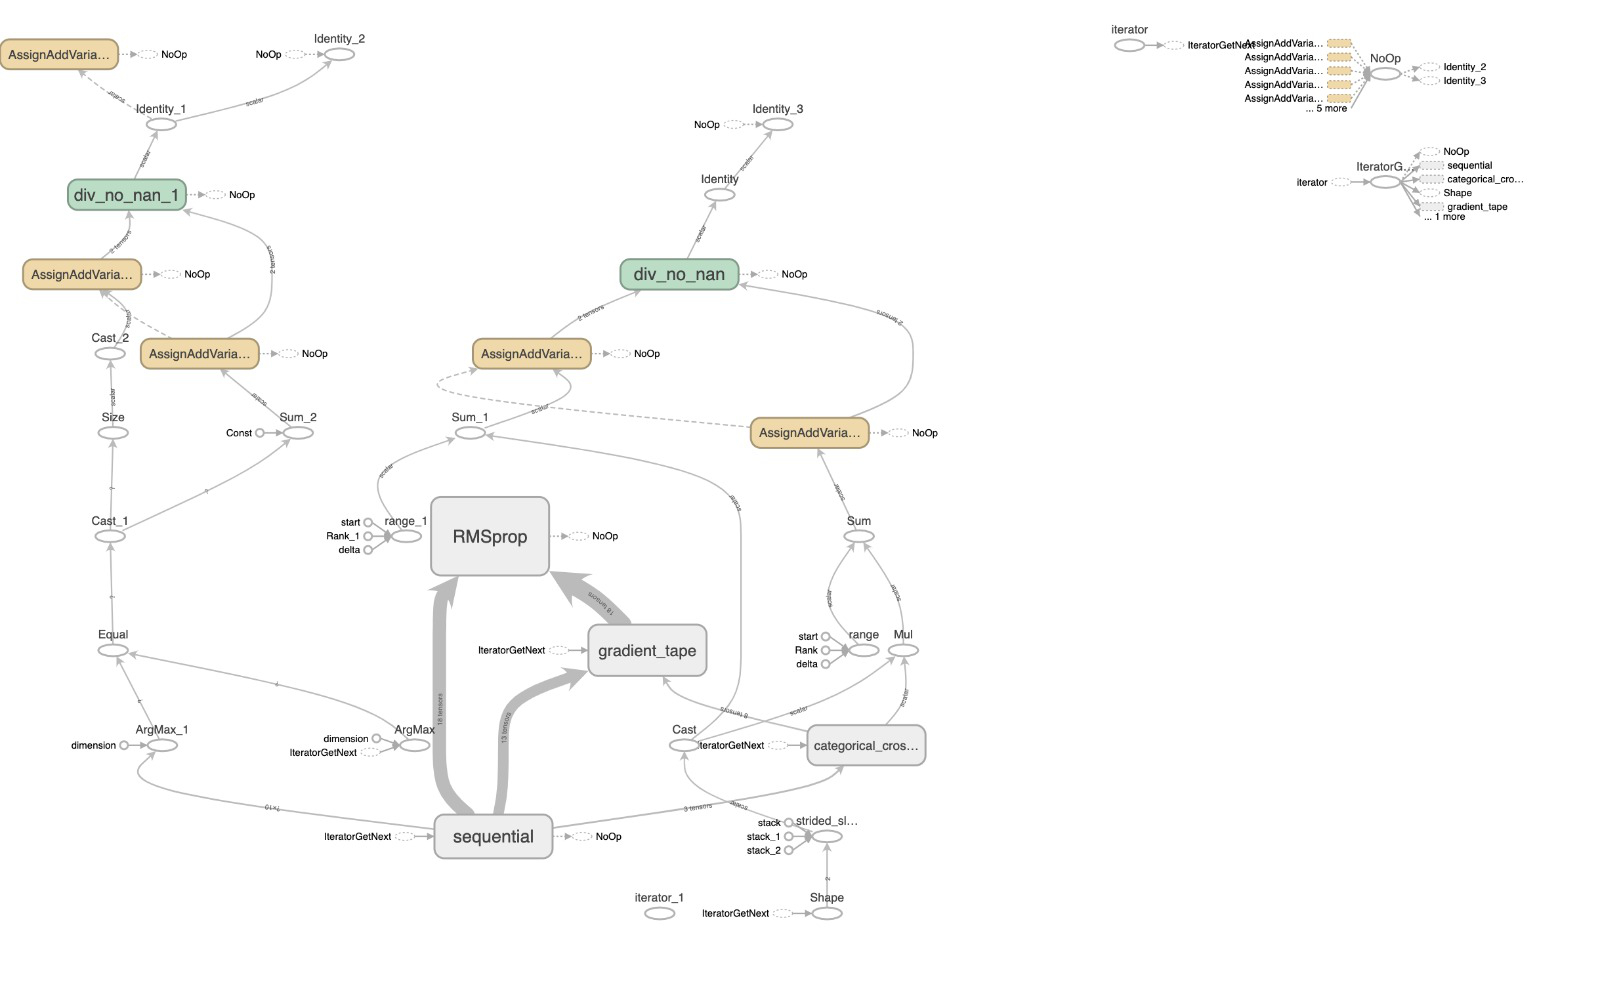
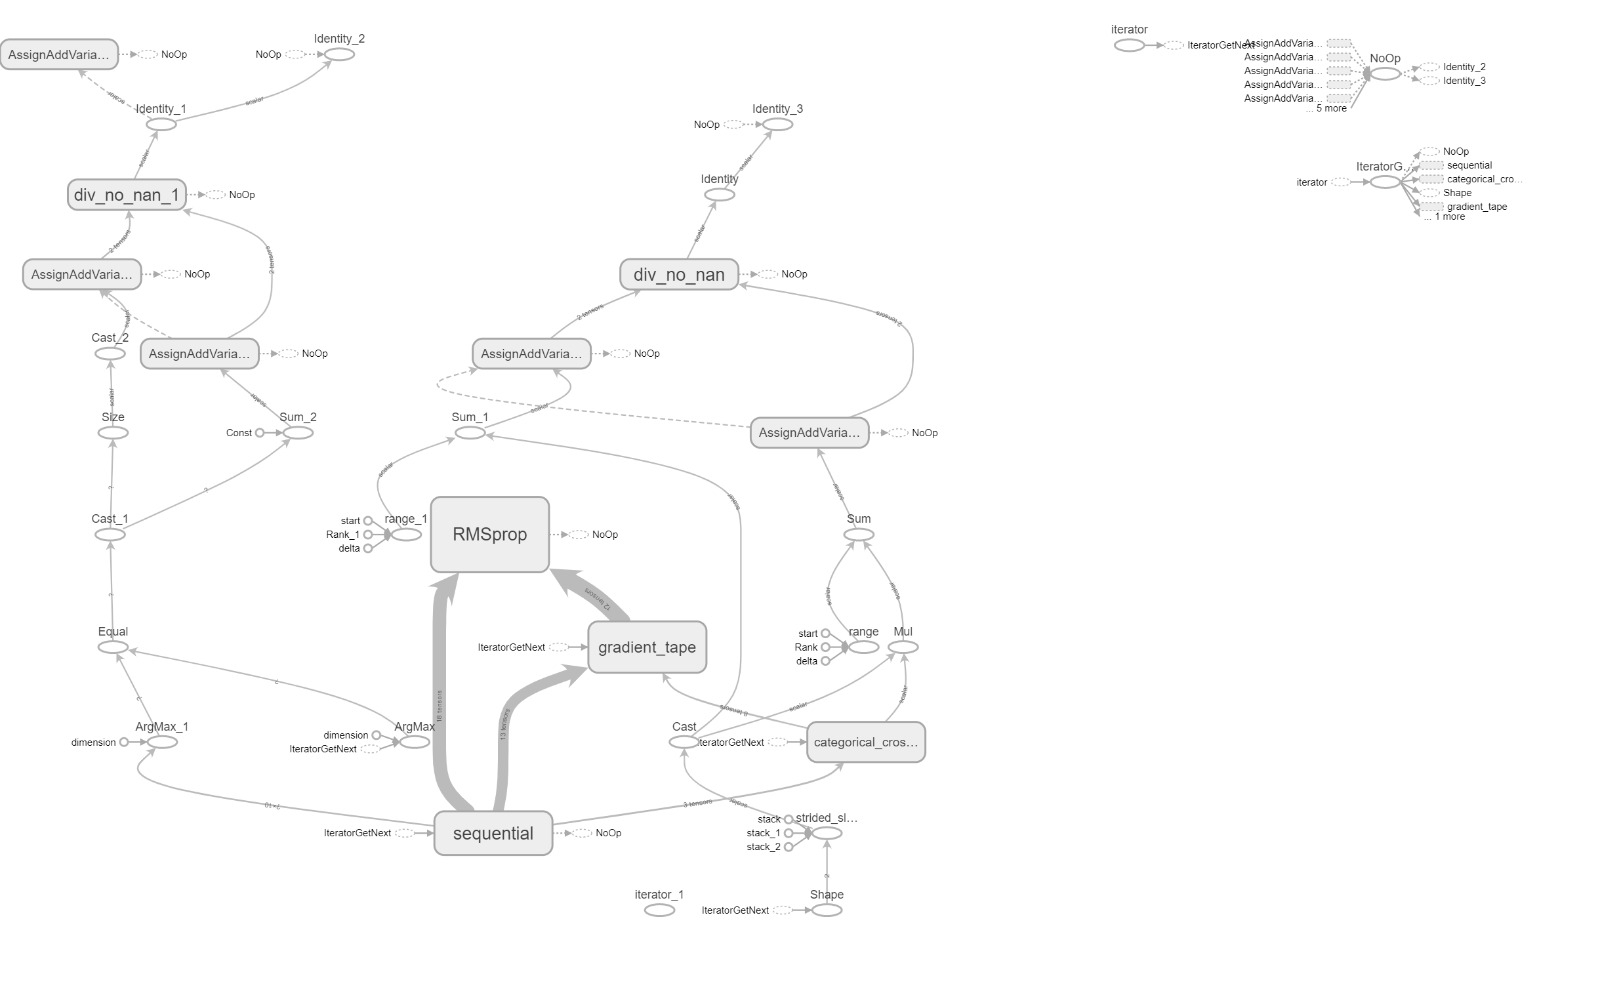
Main graph:
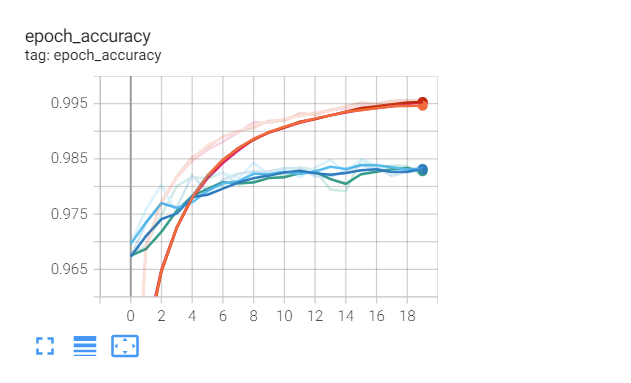
(Edited: 2021-12-05) screen shot of the Tensorflow epoch_accuracy graphs:
((resource:tensorboard epoch curve inclass.png|Resource Description for tensorboard epoch curve inclass.png))
The curves are similar that all of them have increasing accuracy after each epochs and the rate of increase decreases as the accuracy reaches ~99
The curves aren't exactly the same because the initial weights won't be the same in each run and the batches are also randomly chosen on each run.
Main graph:
((resource:tensorboard graph inclass.png|Resource Description for tensorboard graph inclass.png))
2021-12-06
The curves differ because the data is shuffled and the weights are different for every run and the validation data batches are random in each run.
((resource:Capture.jpg|Resource Description for Capture.jpg))
The curves differ because the data is shuffled and the weights are different for every run and the validation data batches are random in each run.
The graphs look similar because the accuracy is increasing in every epoch butit is increasing in different ways because the data has been shuffled for every epoch.
((resource:epoch loss 3.png|Resource Description for epoch loss 3.png))
((resource:graph 3.png|Resource Description for graph 3.png))
The graphs look similar because the accuracy is increasing in every epoch butit is increasing in different ways because the data has been shuffled for every epoch.
2021-12-07

The curves go towards higher accuracy in each iteration <-- similarity between curves.
With each run the data is shuffled i.e. chosen randomly <-- shows they're not exactly same
((resource:WhatsApp Image 2021-12-07 at 1.28.27 PM.jpeg|Resource Description for WhatsApp Image 2021-12-07 at 1.28.27 PM.jpeg))
((resource:WhatsApp Image 2021-12-07 at 1.31.23 PM.jpeg|Resource Description for WhatsApp Image 2021-12-07 at 1.31.23 PM.jpeg))
The curves go towards higher accuracy in each iteration <-- similarity between curves.
With each run the data is shuffled i.e. chosen randomly <-- shows they're not exactly same
 There is slight difference in graphs because the data is shuffled for each run and the validation data used would be different for each epoch.
((resource:dec1 .jpeg|Resource Description for dec1 .jpeg))
((resource:dec1.1.jpeg|Resource Description for dec1.1.jpeg))
There is slight difference in graphs because the data is shuffled for each run and the validation data used would be different for each epoch.
(c) 2024 Yioop - PHP Search Engine